Monitoring the enterprise network is one of the most essential tasks that network engineers have to do regularly. Once the network is deployed, new equipment is installed, or some devices are reconfigured, you need to verify that the network is stable and no issues are reported.
Regularly monitoring the network also helps to understand better how it operates on different levels. The collected information can be used for various analyses, and knowing the strengths and weaknesses of the network dramatically helps to upgrade the network properly.
There are several methods that you can use to monitor your network. Though they have the same functionality, some provide more information than others.
In this article, we will provide the following:
- An overview of Syslog.
- An overview of SNMP.
- An overview of NetFlow.
Not what you were looking for today? View some of our popular articles:
- What Is a GRE Tunnel and How Do You Configure One?
- The Complete Solutions Guide to a Redundant Switched Topology – Pt. 1
- 4 Steps of Private VLAN Configuration (Back to Basics)
An Overview of Syslog
Syslog is a standard network-based logging protocol that allows sharing of event notification messages across the network or locally on the device. The Syslog service is enabled by default on Cisco devices. When something happens on a device, such as failing an interface, it sends a corresponding syslog message to the logging process.
The logging process is responsible for collecting event messages and distributing them to various destinations, such as the console line, the terminal lines, the internal logging buffer of the device, or an external syslog server. The destinations that will be configured on a single device, as well as the type of syslog messages that will be generated and logged, are typically based on the requirements you have.
Although the logging service, compared to other monitoring protocols, is the simplest one, it provides more than sufficient data for deep monitoring and solid troubleshooting. The best option for logging is to use an external syslog server. This way, all devices in the network will send log messages to a single server, and then by using management software you can represent the learned data with graphics and charts.
_________________
Don't let support dates for a particular piece of network hardware get in the way of you achieving your goal. Let OneCall, PivIT's maintenance offering, cover network devices. Connect with our team to see if this would be a good fit for your network.

_________________
Exploring the Syslog Message Format
The format of a syslog message is very simple and consists of three parts: Priority (PRI), Header, and the message itself (MSG).
The priority is an 8-bit number representing two different things: the facility (5 bits) and the message's severity (3 bits).
The facility is a number value and represents the source of the message, such as an operating system, process, or application. The severity specifies the severity of the message, or, in other words, how severe the reported issue is. There are 8 severity levels (from 0 to 7), where the lower number represents a more severe issue.
Syslog messages that are generated by the Cisco IOS software are structured in the following format: Seq no:timestamp: %facility-severity-mnemonic: description. The meaning of each parameter is following:
- Seq no: represents the message sequence number.
- Timestamp: the date and time when the message originated.
- Facility: the source of the message.
- Severity: a number representing the severity of the message.
- Mnemonic: Complimentary data to Facility information.
- Description: Explanation of the meaning of the message in plain language.
To better understand what a syslog message looks like and what information it provides, let’s take a look at the following syslog message:
*Nov 17 21:12:23.233: %LINEPROTO-5-UPDOWN: Line protocol on Interface FastEthernet0/1, changed state to up
As you can see in the example above, the syslog message was created on Nov 17 at 21:12:23.233. The facility code is LINEPROTO, and this tells us that the message provides info about line protocol. The severity level is 5, and the mnemonic of UPDOWN compliments the line protocol (up or down). The description provides information about the reason why the syslog message was generated.
If you want to export syslog messages to an external syslog server, you need to define the IP address of the server, the severity level of the syslog message that you want to log, and eventually, change the source IP address of the message to an IP address of some interface (usually this is a loopback interface).
The following commands achieve that requirement:
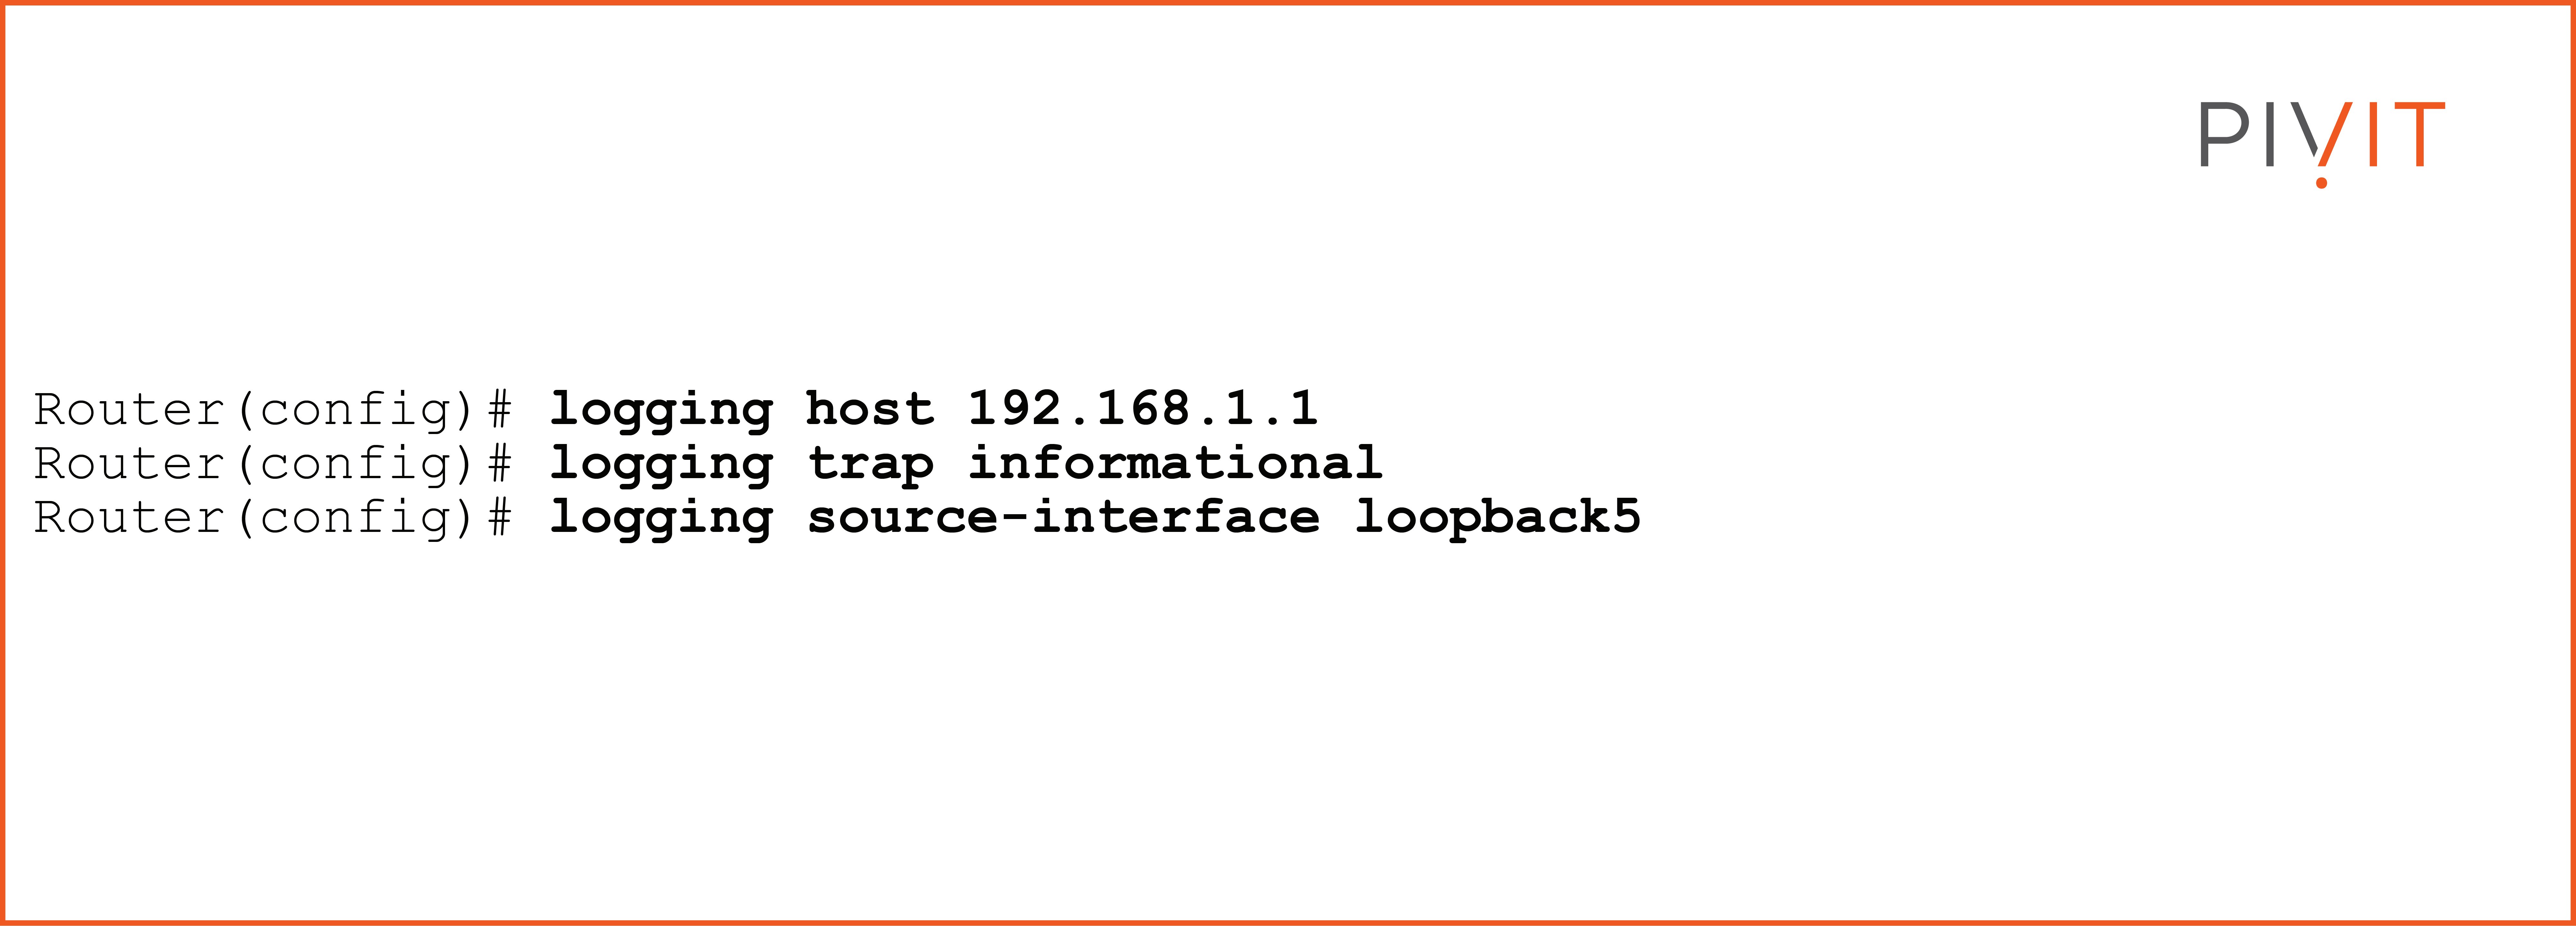
Based on the configuration example above, the router will send a syslog message of severity level informational (level 6) and all levels below to the syslog server at 192.168.1.1, with a source IP address used on interface loopback5.
An Overview of SNMP
When more details are required than the syslog service can provide when monitoring the network, you need to switch to another more advanced protocol.
Simple Network Management Protocol (SNMP) is a commonly used management protocol in the network that allows exchanging of various information between monitored devices such as routers, switches, or firewalls with an SNMP manager.
SNMP protocol consists of three components:
- SNMP agent: Service that runs on the managed network device and responds to requests from the manager (NMS). In addition, it also generates trap messages and sends them to the manager when certain thresholds are reached.
- SNMP manager: Also known as a Network Management Station (NMS). It is a computer system that periodically or on-demand queries the agents on managed devices in the network for specific data. Any software that supports the SNMP format can display the collected information.
- Management Information Base (MIB): A database that contains collections of managed objects. Each object represents specific information, such as CPU usage, interface status, et cetera.
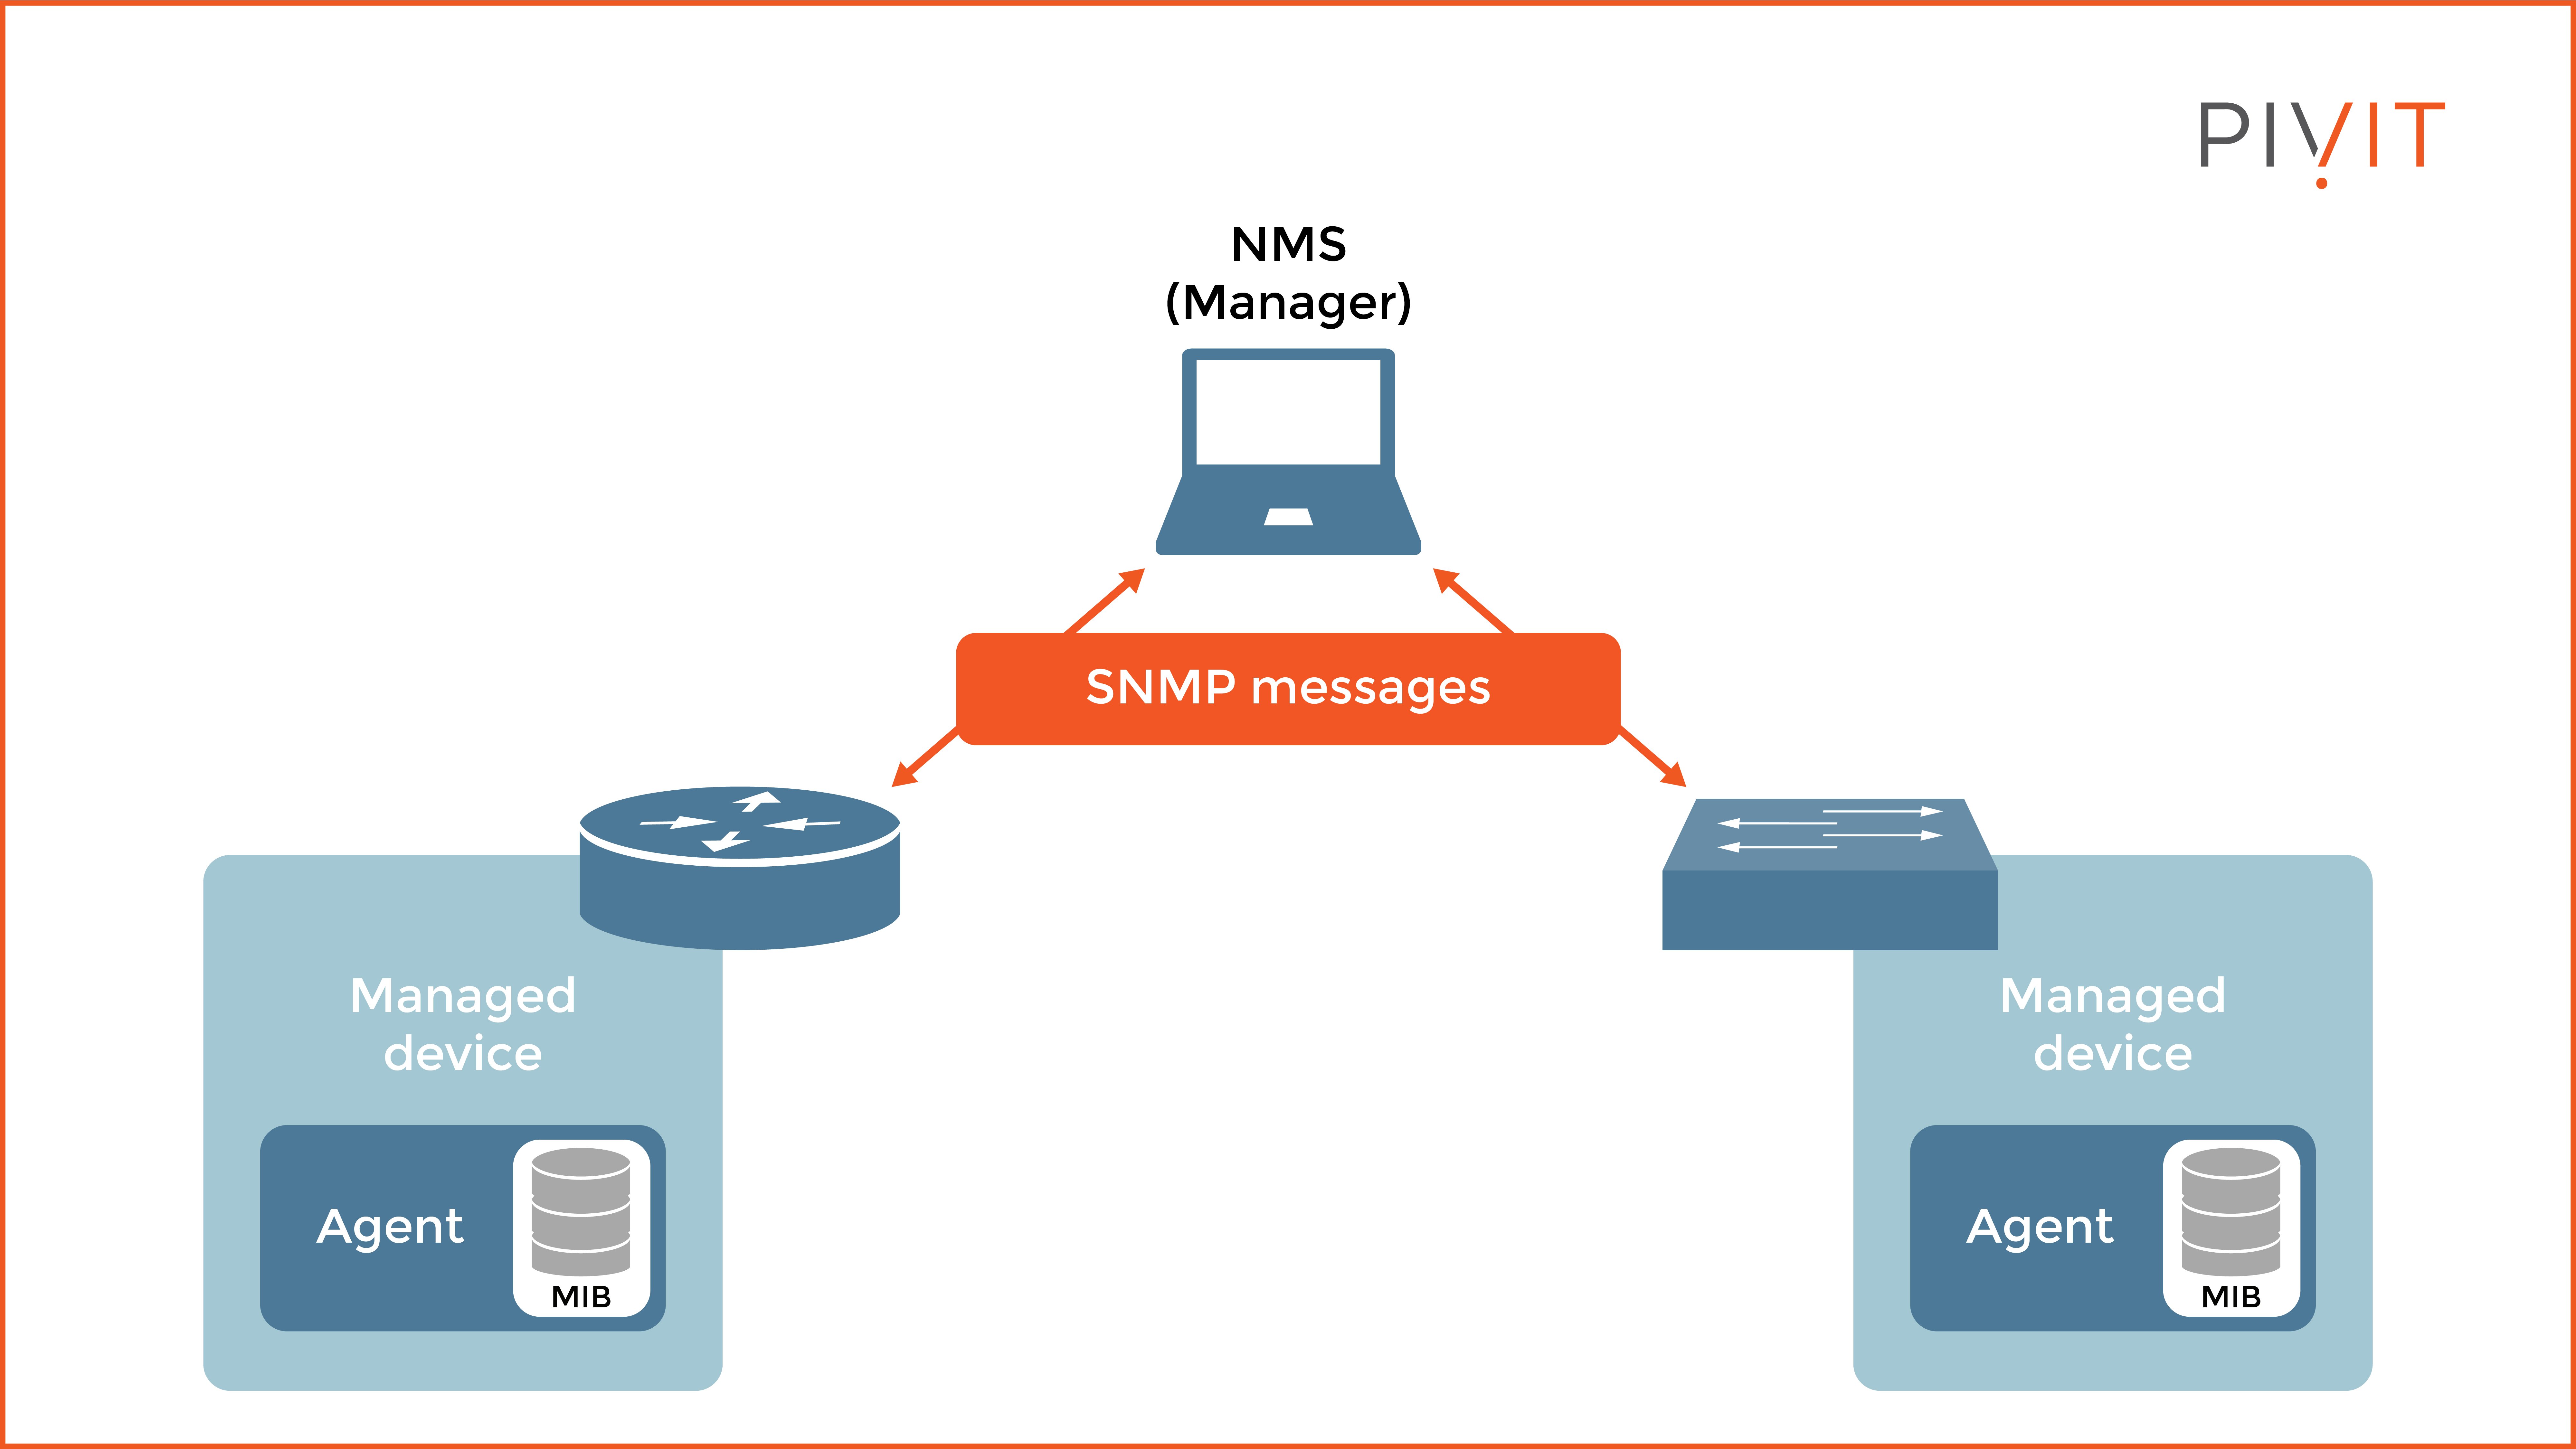
As you can see in the image above, each network device runs a special process called an agent that responds to the NMS queries regarding many things, such as CPU usage, interface status, interface traffic, and more.
At the same time, the agents can send trigger messages (trap and inform messages) when an explicitly defined threshold is reached. Several types of SNMP actions are involved in the SNMP exchange process: get, get-next, get-bulk, set, trap, and inform.
SNMP protocol is supported in three different versions, each with different characteristics. Versions SNMPv1 and SNMPv2 are not recommended because they lack support for a secure exchange of data, while SNMPv3 supports strong authentication, encryption, and integrity.
_________________
Let PivIT handle the installation of your network monitoring solution with EXTEND, which serves as a seamless and confidential extension of your IT teams. Consider us your boots on the ground working to cost-effectively extend your reach and complete your projects.

_________________
An Overview of NetFlow
Besides using syslog and SNMP, which are considered mainstream monitoring protocols in the networks, another method can also be used, NetFlow. NetFlow is a Cisco protocol that provides statistics on packets flowing through the devices in the network in a more dynamic way.
As the name suggests, NetFlow identifies packet flows for both inbound and outbound IP packets on the devices. A single NetFlow network flow defines a unidirectional stream of packets between a source and a destination host. Seven parameters (key fields) define a unique flow, and they are:
- Source IP address.
- Destination IP address.
- Source port.
- Destination port.
- Layer 3 protocol type.
- Type of Service (ToS).
- Input interface.
When several packets are exchanged between a given source and destination, they are considered to be part of the same flow when the values in the seven key fields are the same. However, if a packet has one key field different from another packet, it is considered to belong to another flow.
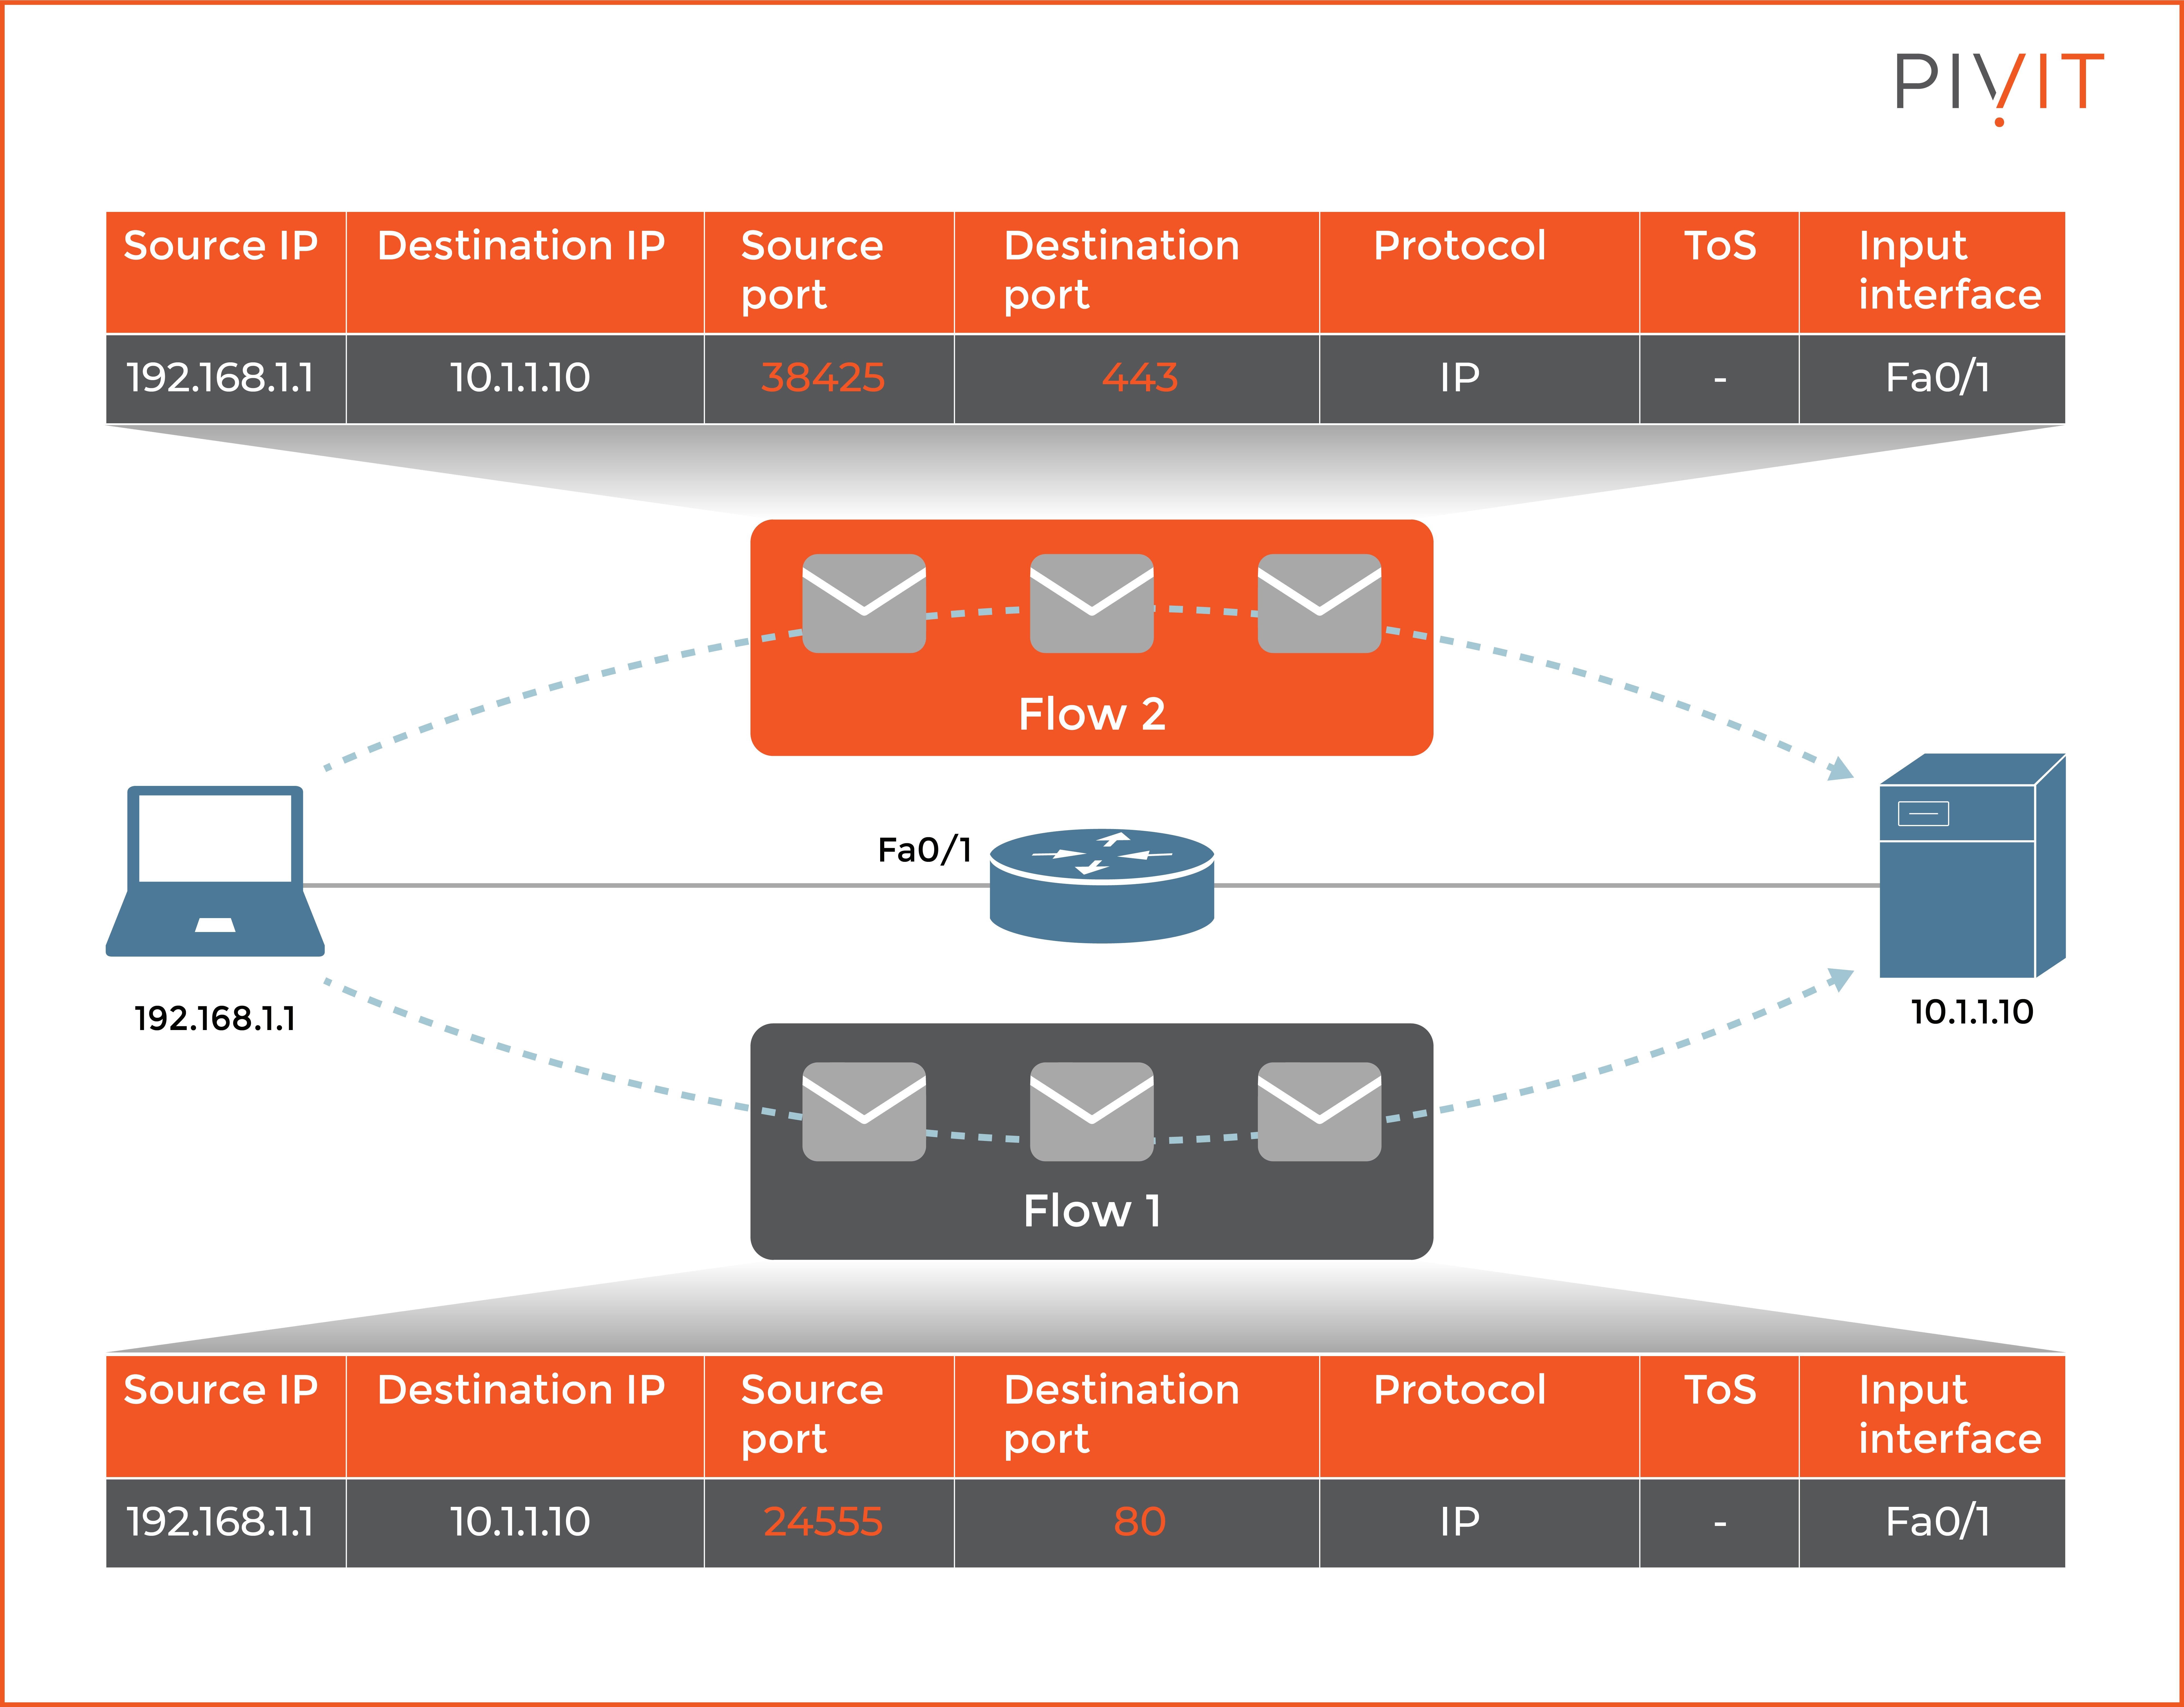
As you can see in the image above, the router creates two different traffic flows because the source and destination ports are different in the communications between the computer and the server.
NetFlow does not need to be operational on all NetFlow-enabled devices in the network, but only on those devices on which you need to create traffic flows. The collected data can be used to recognize unusual network behavior, and help in forensic analysis after a network attack.
Although there are several versions of NetFlow, it is recommended to use the latest version, 9. However, as good as this version is, it is limited to using the fixed seven key fields (also known as tuples) to identify a flow. Because this approach will not provide the best results in some use cases, you can replace the standard NetFlow with Flexible NetFlow.
Flexible NetFlow allows the traffic flow to be user-defined instead of relying on the seven tuples. This way, you can specify only the criteria that would be the most beneficial in a certain scenario to identify a flow and understand the network behavior more efficiently afterward.
The Importance of Monitoring
One of the most common mistakes in computer networks is assuming that the network will work as expected after performing some hardware or configuration updates.
Many things can go wrong without any particular reason, so you should continually monitor the network and discover potential flaws. It’s up to you to choose the most appropriate networking protocol and deploy it in your network.